Data Sampling in Analytics: Why Your Reports Show Different Numbers
 Leon Bauer
·
·
·
5 min read
Leon Bauer
·
·
·
5 min read
You pull the same report twice. Same site, same date range, same dashboard. And somehow the numbers do not match. One run says 48,000 sessions, the next says 47,200. Did your traffic time-travel? Did you break something? Nope. You just bumped into one of the quietest gremlins in web analytics: data sampling.
Data sampling is the reason your reports can show different numbers for the exact same question. It is not a bug, and it is not your fault. But if you do not understand it, you can end up making decisions on numbers that were never meant to be exact.
Let’s break this down together. By the end, you will know what data sampling is, when it kicks in, and how to keep it from messing with your reports.
What Is Data Sampling in Analytics?
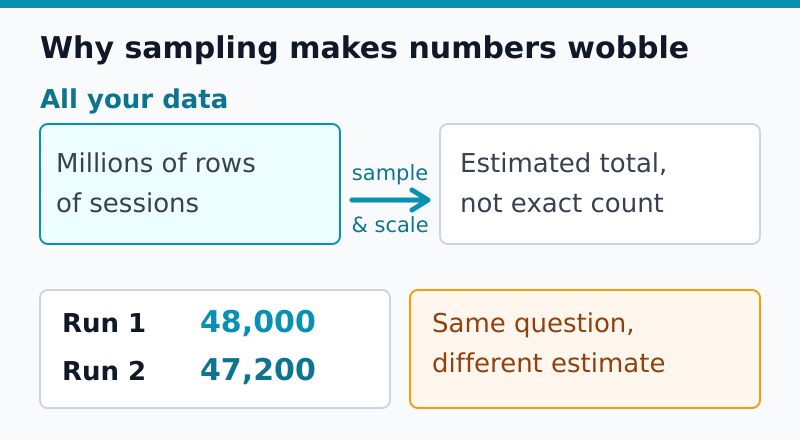
Data sampling is when an analytics tool looks at a slice of your data instead of all of it, then scales the result up to estimate the full picture. Think of it like tasting a spoonful of soup to judge the whole pot. You do not eat the entire pot to know it needs salt.
So instead of crunching every single one of your millions of rows, the tool grabs a representative sample, runs the math, and multiplies. The result is fast. It is also an estimate, which means it carries a little wobble.
Here is the kicker. Two samples drawn from the same data can differ slightly. That is why the same report can hand you two different totals on two different runs.
Why Analytics Tools Use Sampling at All
If sampling causes confusion, why do tools use it? The answer is simple: speed and cost. Processing every row of a high-traffic site for a complex report can take serious computing power. Sampling delivers an answer in seconds instead of minutes.
For most questions, an estimate within a percent or two is perfectly fine. If you want to know whether organic search is trending up, you do not need the number down to the last session. The trend is the point.
That said, sampling becomes a problem when you need precision. Reporting exact revenue, reconciling conversions, or chasing tiny segments all demand real numbers, not estimates.
When Does Sampling Kick In?
Sampling is not random. Certain conditions make it far more likely. Watch for these triggers:
- Long date ranges. A full year of data is a lot more rows than a single week. The more rows, the more likely sampling appears.
- High traffic volume. Busy sites cross processing thresholds faster than quiet ones.
- Complex reports. Stacking multiple dimensions, segments, and filters forces the tool to work harder, so it leans on a sample.
- Custom queries. Off-the-shelf reports are often pre-computed. The moment you build something custom, sampling becomes more likely.
If you stay within short ranges and simple, standard reports, you may never see sampling at all. The complexity is what invites it in.
How to Spot Sampled Data
Most tools tell you when a report is sampled, but the signal is easy to miss. Look for a small note or icon near the top of the report that mentions a percentage of sessions used. A line like “based on 42% of sessions” is your sampling flag.
There are also softer clues:
- The same report returns slightly different totals when you refresh it.
- Small segments show suspiciously round or jumpy numbers.
- Your detailed report does not add up to your high-level summary.
When you see those signs, treat the numbers as approximate. They are great for direction, shaky for precision.
Sampling vs Other Reasons Numbers Disagree
Sampling is not the only reason analytics numbers fight each other. Before you blame it, rule out these common culprits:
| Cause | What It Looks Like |
|---|---|
| Sampling | Same report, slightly different totals on refresh |
| Time zone mismatch | Two tools split traffic at different midnight points |
| Filters or bot exclusion | One report removes traffic another keeps |
| Different metric definitions | Sessions, visits, and users count different things |
| Consent and blocking | Some visitors opt out, so tools see different totals |
Mismatched definitions are sneaky. If you want a refresher on how tools even decide what a person is, our piece on what counts as a visitor untangles the terminology.
How to Reduce or Avoid Sampling
You cannot always switch sampling off, but you can shrink its impact. Try these tactics when accuracy matters:
- Shorten the date range. Pull one month at a time instead of a full year, then add the pieces together.
- Simplify the report. Drop extra dimensions and segments you do not strictly need.
- Use standard reports where you can, since they are more likely to use complete data.
- Export raw data for the questions that demand exact numbers, then analyze it yourself.
And if precise, unsampled data is a constant requirement, that is worth weighing when you choose a platform in the first place. Some privacy-focused tools process all of your data by default rather than estimating from a slice. We compared several of them in our roundup of analytics platforms.
Frequently Asked Questions
Is sampled data still useful?
Absolutely. For spotting trends, comparing periods, and understanding broad behavior, sampled data does the job well. It only becomes a problem when you need exact figures for reporting or reconciliation.
Does every analytics tool use sampling?
No. Sampling is common in tools built to handle massive data volumes quickly. Many lightweight and privacy-first tools process complete data because their reports are simpler and their scale is smaller.
How much can sampled numbers be off?
It varies with the size of the sample. A large sample stays very close to the true value, while a tiny sample on a small segment can swing more noticeably. The smaller the slice, the more cautious you should be.
Bottom Line
Data sampling is not a flaw to fear. It is a trade-off that buys you speed in exchange for a little precision. Once you know it exists, the mysterious shifting numbers stop being mysterious.
No fluff, just straight answers. Remember these takeaways:
- Sampling estimates from a slice of your data, so totals can wobble.
- Long ranges and complex reports trigger it most often.
- Look for the sampling note before trusting a number as exact.
- Shrink ranges and simplify reports when precision matters.
Treat sampled data for what it is: a quick, useful estimate. Save the exact numbers for the moments that truly need them, and you will never be fooled by a refreshing report again.

Leon Bauer
Explorer of web analytics and digital measurement tools. I dive deep into features, limitations, and use cases of platforms like Google Analytics, Matomo, Plausible, and others. My mission is to demystify analytics through honest reviews and practical guides.
More about me →