
You open your analytics dashboard on Monday morning, coffee in hand, ready to make sense of last week’s numbers. And then it hits you — dozens of charts, hundreds of metrics, percentages going up, percentages going down. Your eyes glaze over. Where do you even start? If this sounds familiar, you’re definitely not alone. Most people who work with analytics reports feel overwhelmed at some point. But here’s the good news: you don’t need to understand every single number to make smart decisions.
In this guide, I’ll walk you through exactly how to read analytics reports without drowning in data. Whether you’re a marketer, a small business owner, or someone who just inherited a Google Analytics account, these steps will help you cut through the noise. Let’s break this down together.
Why Analytics Reports Feel So Overwhelming
Before we jump into the how-to, let’s talk about why analytics reports feel like drinking from a fire hose. First, most analytics platforms show you everything at once. Google Analytics alone tracks over 200 different metrics by default. That’s not a dashboard — that’s a data dump.
Second, there’s the jargon problem. Terms like “sessions,” “bounce rate,” “engagement rate,” and “attribution” get thrown around as if everyone learned them in school. Spoiler: nobody did. If you’ve ever wondered what actually counts as a visitor, you’re asking exactly the right question.
Third, there’s pressure. When your boss asks “how did the website perform this month?” — you feel like you need to have a perfect answer backed by seventeen charts. In reality, you just need to know a handful of key numbers and what they mean for your goals.
Step 1: Start With Your Goal, Not the Data
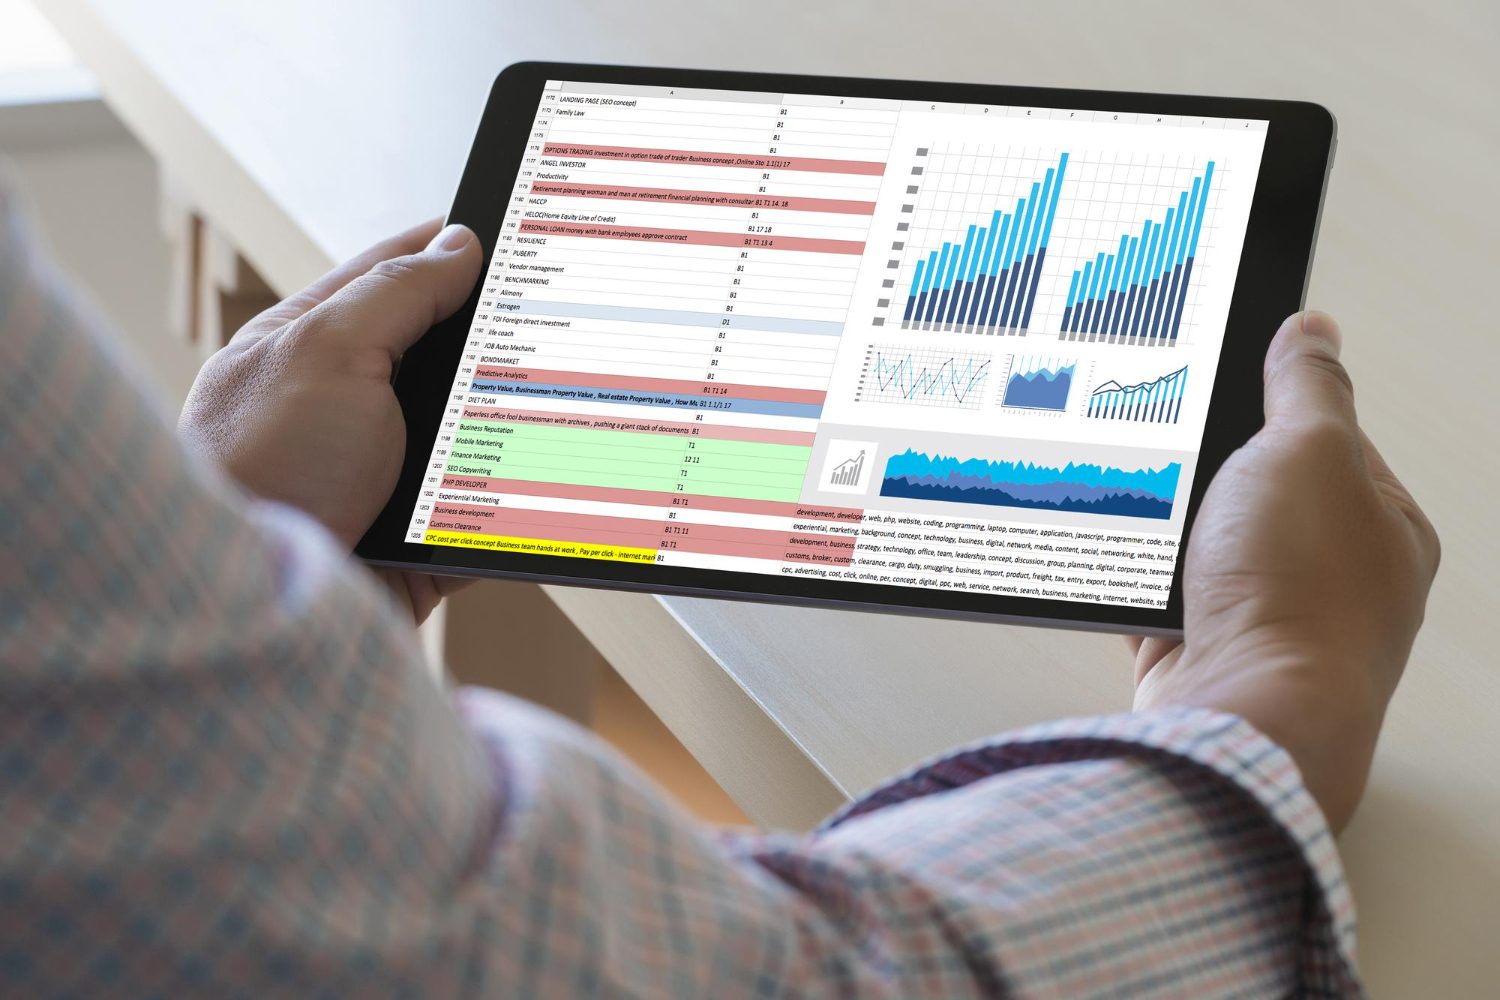
Here’s the kicker — most people open their analytics reports and start scrolling through whatever the dashboard shows them. That’s backwards. Instead, always start by asking yourself one simple question: What am I trying to learn?
Your goal determines which metrics matter. For example, if you want to know whether your latest blog post attracted readers, you care about page views and traffic sources. If you want to know whether your landing page converts visitors into customers, you need conversion rate and bounce rate data.
Here’s a quick reference to help you match goals to metrics:
| Your Goal | Key Metrics to Check | Where to Find Them |
|---|---|---|
| Are people finding my site? | Users, sessions, traffic sources | Acquisition reports |
| Is my content engaging? | Time on page, scroll depth, pages per session | Engagement reports |
| Are visitors converting? | Conversion rate, goal completions | Conversion reports |
| Where do visitors drop off? | Bounce rate, exit pages | Behavior reports |
| Which channels work best? | Source/medium, campaign performance | Acquisition > Channels |
Bottom line: never open a report without a question in mind. Otherwise, the data will overwhelm you every single time.
Step 2: Learn the Five Metrics That Actually Matter
You don’t need to memorize every metric in your analytics platform. In fact, for most websites, five core metrics tell you 80% of the story. Let’s go through them.
1. Users (or Unique Visitors)
This tells you how many individual people visited your site during a given time period. It’s your baseline audience number. However, keep in mind that “unique” isn’t always perfectly accurate — cookies and tracking methods have limitations, especially with privacy tools in play.
2. Sessions
A session is a single visit to your site. One user can have multiple sessions. If your session count is much higher than your user count, that’s actually a good sign — it means people are coming back. According to Google Analytics documentation, a session expires after 30 minutes of inactivity by default.
3. Bounce Rate
This is the percentage of visitors who land on a page and leave without interacting further. A high bounce rate isn’t always bad — it depends on the page type. For instance, a blog post with a 70% bounce rate might be perfectly normal. But a product page with 70%? That’s a problem worth investigating.
4. Traffic Sources
Where are your visitors coming from? Organic search, social media, direct traffic, or referrals? This metric helps you understand which marketing channels deliver results. Additionally, it connects directly to your SEO analytics strategy if organic search is a priority.
5. Conversion Rate
This measures the percentage of visitors who complete a desired action — signing up, purchasing, downloading, or whatever goal you’ve defined. It’s ultimately the metric that ties your traffic to actual business outcomes and helps you measure the ROI of your analytics investment.
Step 3: Use the Right Time Frame for Comparison
One of the biggest mistakes people make when reading analytics reports is looking at numbers in isolation. Seeing “5,000 visitors this week” means nothing unless you know how it compares to something.
Here’s how to choose the right comparison period:
- Week over week: Best for spotting short-term trends and campaign impacts. Compare this Monday to last Monday, not to last Sunday.
- Month over month: Good for measuring steady growth or decline. Useful for monthly reports to stakeholders.
- Year over year: The gold standard for avoiding seasonal traffic distortions. December traffic will almost always differ from July traffic — comparing to last December gives you the real picture.
Most analytics platforms let you set a comparison date range right in the interface. In Google Analytics 4, click the date picker in the top right corner and toggle on “Compare.” It takes two seconds and completely transforms how you read the data.
Moreover, always keep external factors in mind. Did you run a promotion? Did a competitor launch something? Was there a holiday? Context turns raw numbers into actual insights.
Step 4: Build a Simple Reporting Routine

Consistency beats complexity every time. Instead of diving into analytics randomly when someone asks a question, set up a simple routine. Here’s a practical framework that works for most teams:
| Frequency | What to Check | Time Needed |
|---|---|---|
| Daily (optional) | Real-time traffic, any anomalies | 2 minutes |
| Weekly | Users, sessions, top pages, traffic sources | 10-15 minutes |
| Monthly | Full performance review, conversions, trends | 30-45 minutes |
| Quarterly | Strategic review, goal adjustments, channel ROI | 1-2 hours |
The weekly check is the sweet spot for most people. It gives you enough data to spot trends without consuming your entire day. During your weekly review, focus on these three questions:
- Did traffic go up or down compared to last week? Why?
- Which pages got the most attention? Are they the right pages?
- Where did visitors come from, and does that align with your current marketing efforts?
That’s it. You can answer those questions in 15 minutes. Furthermore, if you notice something unusual — like a sudden traffic spike or drop — that’s when you dig deeper. Otherwise, save the deep dives for your monthly review.
Step 5: Focus on Trends, Not Individual Numbers
Here’s something that took me way too long to learn: individual data points are almost meaningless on their own. A single day’s traffic could be influenced by anything — a web analytics expert once told me that daily fluctuations of 10-20% are completely normal for most websites.
What actually matters is the direction things are moving over time. Ask yourself:
- Is traffic gradually increasing week over week?
- Is bounce rate trending down after you made site improvements?
- Are conversions growing even if total traffic is flat?
- Is your content engagement rate improving with different content formats?
Trends give you confidence. If organic traffic has been rising 5% per month for the last six months, you know your SEO strategy is working. A single bad week doesn’t erase that trend — it’s just noise.
To spot trends easily, use line charts instead of tables when possible. Most analytics platforms default to line charts for time-based data, and that visual representation makes patterns immediately obvious. Additionally, consider setting up automated reports that get emailed to you weekly — platforms like Google Analytics support scheduled email reports that save you from even having to log in.
Step 6: Know What to Ignore (Seriously)
This might sound counterintuitive, but one of the most important skills in reading analytics reports is knowing what to skip. Not every metric deserves your attention. In fact, some metrics actively distract you from what matters.
Vanity metrics to treat with caution:
- Total page views without context — a single user refreshing a page 50 times inflates this number.
- Average session duration — this metric is notoriously unreliable because analytics tools can’t measure time on the last page of a visit.
- Raw traffic numbers without conversion data — 100,000 visitors who don’t convert are less valuable than 1,000 who do.
Metrics worth your time:
- Conversion rate by channel — shows you which traffic sources bring quality visitors.
- Engaged sessions (GA4) — counts only sessions where users actually interacted with your site.
- Revenue or goal completions per session — connects traffic directly to business value.
- Page load speed — slow pages kill conversions, so always keep an eye on your mobile load times.
As a result, you’ll spend less time staring at dashboards and more time acting on insights that actually move the needle.
Common Mistakes When Reading Analytics Reports
Even experienced marketers fall into these traps. Here are the most common mistakes I see — and how to avoid them.
Mistake 1: Reacting to every fluctuation. Traffic dipped 8% on Tuesday? Don’t panic. Check if it’s part of a larger trend first. Short-term dips happen for all sorts of reasons — server issues, tracking glitches, or simply a slow news day. Only investigate if the dip persists for a week or more.
Mistake 2: Comparing apples to oranges. Comparing a weekday to a weekend, or December traffic to March traffic, will lead you to wrong conclusions. Always compare like-for-like time periods. As I mentioned earlier, year-over-year comparisons are particularly helpful for accounting for seasonal patterns.
Mistake 3: Ignoring segments. Your “average visitor” doesn’t exist. Mobile visitors behave differently from desktop visitors. Organic traffic converts differently from paid traffic. Therefore, segment your data before drawing conclusions. Most platforms let you filter by device, location, traffic source, and more.
Mistake 4: Forgetting about data quality. If your tracking setup is broken or incomplete, your reports will be misleading. Make sure your analytics code is installed correctly on all pages, that you’ve filtered out internal traffic (your own visits), and that bot traffic isn’t inflating your numbers.
Mistake 5: Never acting on the data. This one’s the most common of all. Reading reports is pointless if you don’t do something with the information. Every analytics session should end with at least one action item — even if it’s just “keep doing what we’re doing because the numbers look great.”
Frequently Asked Questions
How often should I check my analytics reports?
For most websites, a weekly check is the sweet spot. This gives you enough data to identify meaningful trends without getting lost in daily noise. If you run an e-commerce store or time-sensitive campaigns, a quick daily glance at real-time data can also be helpful. However, your deep-dive analysis should happen monthly or quarterly — that’s where the strategic insights live.
What’s the most important metric to track?
It depends entirely on your goals, but if I had to pick just one, it would be conversion rate. Traffic without conversions is just vanity. Conversions — whether that’s purchases, sign-ups, downloads, or contact form submissions — connect your website activity to real business outcomes. Everything else is a supporting metric that helps explain why conversions go up or down.
Do I need to learn Google Analytics to read reports effectively?
Not necessarily. While Google Analytics is the most popular platform, the principles in this guide apply to any analytics tool — whether you’re using Matomo, Plausible, or something else entirely. The concepts of users, sessions, traffic sources, and conversions are universal. That said, spending an hour learning the basics of whatever platform you use will pay off tremendously. Most platforms offer free tutorials and documentation to get you started.
Key Takeaways
Reading analytics reports doesn’t have to feel like deciphering ancient code. In fact, once you build a simple routine and focus on what matters, it becomes genuinely enjoyable — you start seeing patterns, understanding your audience, and making confident decisions.
Here’s your quick-reference checklist to keep handy:
- Always start with a question. Never open a report without knowing what you’re looking for.
- Focus on five core metrics: users, sessions, bounce rate, traffic sources, and conversion rate.
- Compare time periods. Numbers in isolation mean nothing — context is everything.
- Build a weekly routine. Fifteen minutes per week beats a three-hour monthly panic session.
- Watch trends, not blips. One bad day doesn’t define your performance.
- Ignore vanity metrics. Page views without conversion data are just feel-good numbers.
- Take action. Every report review should produce at least one next step.
Bottom line: the best analytics report is the one that helps you make a better decision today than you made yesterday. You don’t need a data science degree — you just need the right questions and a bit of consistency. Now go open that dashboard with confidence. You’ve got this.

Leon Bauer
Explorer of web analytics and digital measurement tools. I dive deep into features, limitations, and use cases of platforms like Google Analytics, Matomo, Plausible, and others. My mission is to demystify analytics through honest reviews and practical guides.
More about me →