

You open your analytics dashboard. One number says 1,200 visitors. Another says 3,400 sessions. A third says 9,800 pageviews. All three are correct. None of them answers the question you actually had, which was: is this thing working or not?
Website visitor statistics get confusing fast, mostly because tools measure different things and call them similar names. Let’s break this down together. I’ll cover which numbers matter, what each one really counts, and how to collect them without turning your site into a surveillance operation.
Why Visitor Statistics Confuse Everyone
The core problem is simple. A “visitor” isn’t a person. It’s a guess.
Analytics tools can’t see people. They see requests arriving at a server. Then they group those requests using whatever signal they have — a cookie, a session token, or a fingerprint of the request itself. That grouping is an estimate, and different tools estimate differently.
Here’s the kicker: the same traffic measured by two tools will produce two different visitor counts. Neither is lying. They just drew the boundaries in different places. I dug into where those boundaries sit in this piece on what actually counts as a visitor.
So the goal isn’t a perfect number. The goal is a consistent number you can compare week to week.
The Five Numbers Worth Watching
Most dashboards show forty metrics. You need about five. Here they are, with what each one actually tells you.
| Metric | What it counts | Use it to answer |
|---|---|---|
| Visitors | Estimated unique people in a period | Is my audience growing? |
| Sessions | Visits, including repeat visits | Do people come back within a period? |
| Pageviews | Every page load | Which content gets read? |
| Sources | Where visitors arrived from | Which channel is working? |
| Entry pages | Where the visit started | What’s pulling people in? |
That’s it. Everything else is a detail you can look up when a specific question comes up.
Notice what’s missing. Time on page, bounce rate, and scroll depth are all interesting, but they’re noisy and easy to misread. If you want to know why bounce rate misleads people so often, I covered the traps in this diagnosis guide. And for small sites specifically, this rundown of metrics for small blogs trims the list even further.
Visitors vs Sessions vs Pageviews
These three get mixed up constantly, so let’s nail them down with one example.
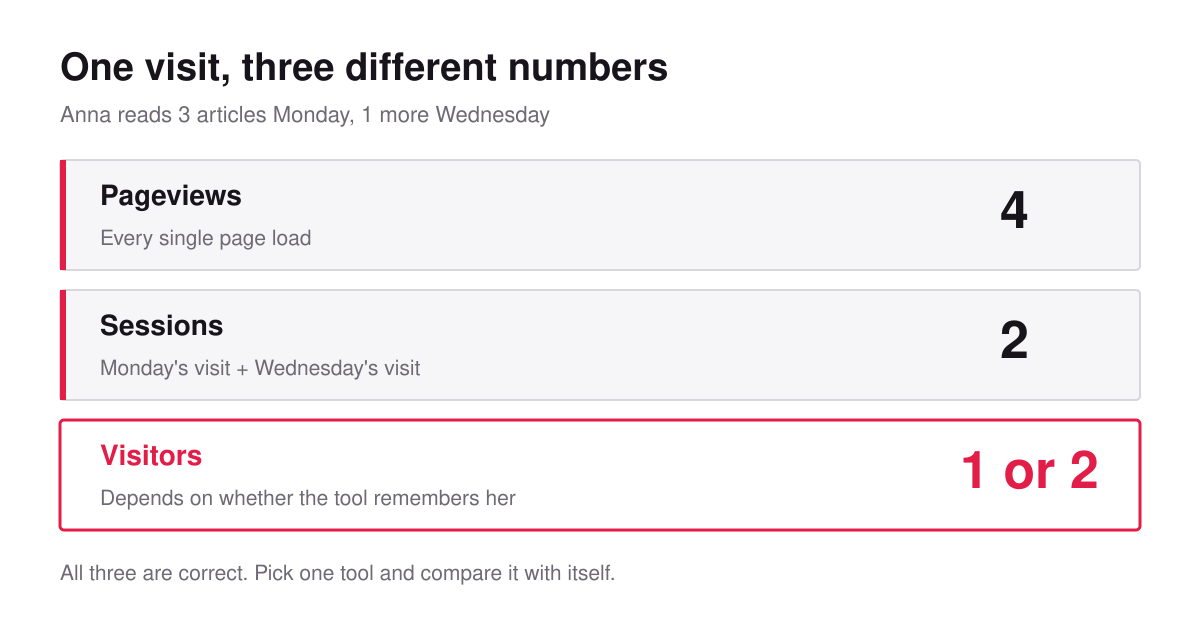
Say Anna visits your site on Monday. She reads three articles. She comes back Wednesday and reads one more.
- Pageviews: 4 — one per page load
- Sessions: 2 — Monday’s visit and Wednesday’s visit
- Visitors: 1 or 2, depending on the tool
That last line is the whole problem. A cookie-based tool remembers Anna across days and reports 1 visitor. A privacy-first tool that doesn’t persist identifiers treats Wednesday as a new visit and may report 2.
Which is right? For “how many humans”, the first. For “am I growing”, both work — as long as you don’t switch tools mid-comparison. Consistency beats precision here, every time.
How to Collect Visitor Statistics Without Cookies
Now the practical part. You can get every number in that table above without storing anything on someone’s device.
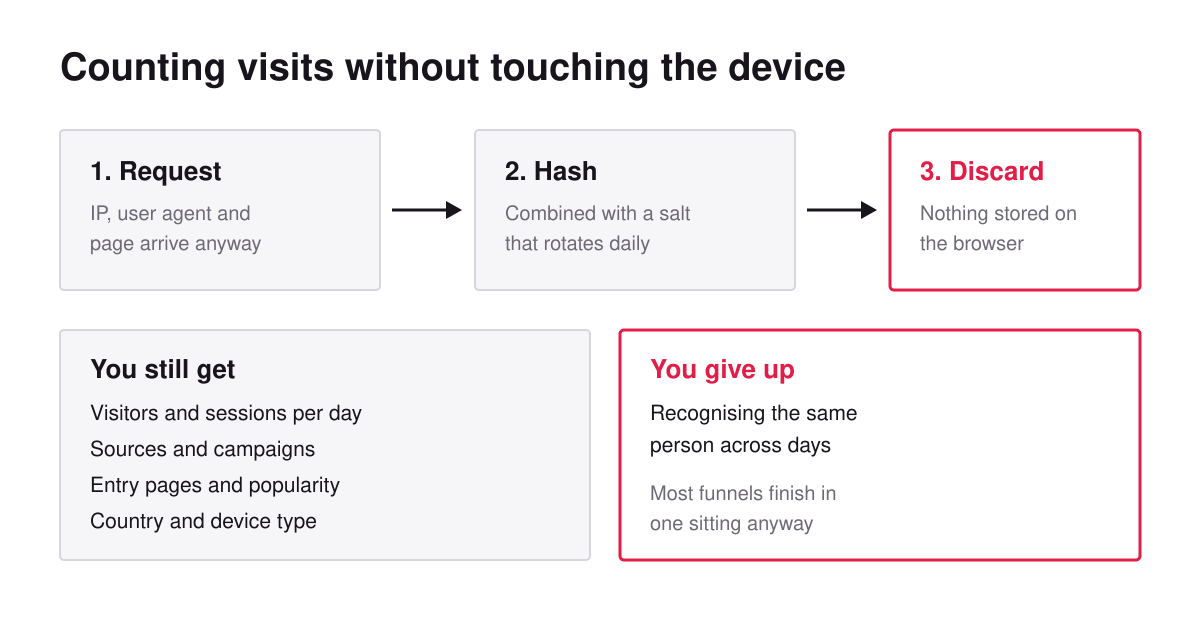
Privacy-first tools count sessions server-side. When a request arrives, the tool derives a temporary identifier from things it already receives — the IP address, the user agent, and a salt that rotates daily. That value gets hashed, used to group the visit, and thrown away. Nothing is written to the browser.
What you get:
- Visitor and session counts for the day
- Full source and campaign attribution
- Page popularity and entry pages
- Country-level geography
- Device type breakdown
What you don’t get: recognition across days. That’s the trade-off, and it’s a real one. I’m not going to pretend otherwise.
But think about what you’d do differently with month-long visitor recognition. For most sites, the answer is nothing. The decisions — write more of this, fix that page, drop that channel — come from aggregate patterns, not from following individuals around. This piece on improving UX without tracking users walks through how far you can get on aggregates alone.
Reading the Numbers Without Fooling Yourself
Three habits save you from most bad conclusions.
Compare the same weekdays. Traffic has a weekly rhythm. A Tuesday-to-Saturday comparison tells you about the calendar, not your content.
Check the absolute number before reacting to a percentage. “Traffic down 40%” means something different at 5,000 visitors than at 12. Small numbers swing wildly for no reason at all.
Look for the cause in sources, not totals. When a total moves, the answer is almost always in one channel. Referral spike, a post picked up somewhere, a campaign that ended. The total just tells you to go look.
One more thing. If your numbers suddenly look strange, suspect the measurement before the audience. Tag broke, plugin updated, sampling kicked in. I’ve lost whole afternoons to “traffic collapsed” that turned out to be a script that stopped loading. This explainer on sampling covers one of the sneakier versions of that problem.
Bot Traffic Skews Everything
Here’s something most guides skip. A meaningful share of raw hits isn’t human.
Crawlers, uptime monitors, security scanners, and scrapers all hit your pages. Good analytics tools filter the known ones. Nobody filters all of them, because new bots appear constantly and plenty don’t identify themselves honestly.
Two signs your stats are inflated:
- Sudden traffic with 100% single-page sessions and near-zero time on site
- Visits from data-center regions where you have no audience
Server-side tools tend to see more of this than script-based ones, simply because bots often don’t run JavaScript. That’s worth knowing when you compare two tools and the server-side one reports higher numbers.
If you want a sense of scale, Cloudflare Radar publishes ongoing measurements of how much web traffic is automated rather than human. The share is high enough that “my traffic doubled overnight” should always trigger a bot check before a celebration.
Choosing Where to Get Your Statistics
You have three realistic options, and the right one depends on how much control you want.
| Option | Good for | Trade-off |
|---|---|---|
| Hosted privacy-first tool | Most sites — setup in minutes | Monthly cost, data on someone’s server |
| Self-hosted tool | Full data ownership | You maintain it and back it up |
| Server log analysis | Zero client-side code at all | Noisy, needs filtering work |
For a comparison of the hosted options I’ve actually run, see the five privacy-first platforms I tested. If you’re weighing hosting it yourself, this breakdown of self-hosted versus cloud covers the maintenance reality. And before you pay for anything, the real cost of free analytics is worth five minutes.
Set a Baseline Before You Change Anything
Here’s the step almost everyone skips. Before you optimise a single page, you need to know what normal looks like.
Give it four weeks. Week one, install the tool and verify it works — load your own site, check your visit shows up, confirm the numbers move when you’d expect. Weeks two through four, change nothing at all. Just let the data collect.
Then write down a typical week in those five numbers and date the note. That’s your baseline. From then on, every change has something to be measured against.
Why does this matter so much? Because “600 visitors last week” is meaningless on its own. It only becomes information when you know the month before was 400, or 900. Without the comparison you’re reading tea leaves, and it’s remarkably easy to congratulate yourself for a seasonal bump.
One more habit that saves grief: change one thing at a time. If you rewrite your titles, launch a newsletter, and start posting on a Tuesday all in the same week, you’ll never know which one moved the line. Slow is faster here.
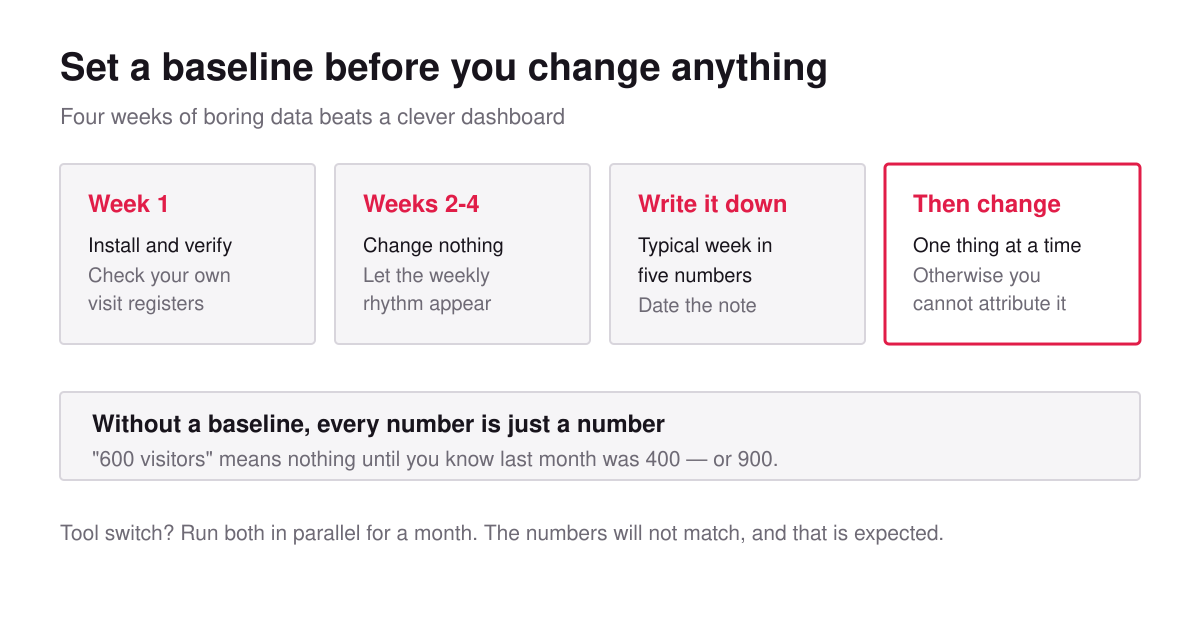
Switching tools? Run both in parallel for a month. The numbers won’t match — expect a gap of 10 to 30% — and seeing the size of that gap on your own traffic is worth more than any benchmark article. Export your history first, though. That part is easy to forget until it’s gone.
What Visitor Statistics Won’t Tell You
Honest limitations, because every guide should have this section.
Why people did what they did. Statistics show that 70% left your pricing page. They never explain whether the price was too high, the copy confusing, or the page broken on mobile. That answer comes from asking people or watching them, not from a chart.
What almost happened. The visitor who nearly signed up and changed their mind looks identical to one who was never interested. Analytics only records what occurred.
Offline effects. Someone reads your article, remembers you three weeks later, and types your name into a search box. That’s a win your traffic report will attribute to “direct” and shrug about.
Small differences. With a few hundred visits a week, a 10% change is noise. Tools present every number to two decimal places, which creates false confidence in precision that isn’t there.
Keep those four in mind and you’ll avoid the most common trap in analytics — treating a number as an explanation. The numbers tell you where to look. You still have to go and look.
Frequently Asked Questions
Why do two tools show different visitor numbers?
Because they define a visitor differently and filter bots differently. Differences of 10–30% between tools are normal. Pick one as your source of truth and stop cross-checking daily.
Do I need consent to collect website visitor statistics?
If your tool stores or reads anything on the visitor’s device, yes — that’s the ePrivacy rule, and it applies regardless of whether the data is personal. Tools that never touch the device sit in a much better position. Regulators differ on the details, so check your own authority’s current guidance.
How much traffic do I need before the numbers mean anything?
Rough rule: a few hundred visits per week before weekly comparisons are stable. Below that, look at monthly totals instead and ignore the day-to-day chart entirely.
Should I track individual visitor journeys?
Usually not. Individual paths feel insightful and rarely change a decision. Aggregate entry pages and sources answer the same questions with far less data and far less risk.
Bottom Line
Website visitor statistics only get useful once you cut them down. Watch five numbers, compare like periods, and check sources whenever a total moves. That’s the whole practice.
You don’t need to identify people to run a website well. Visitors, sessions, pageviews, sources, entry pages — all of it is available without a single cookie, which means it’s available for every visitor rather than just the ones who clicked “Accept”. No fluff — that’s the actual advantage.
Start with one week of clean data and one question you want answered. If you inherited a site with tracking already on it, this audit walkthrough is the better starting point. Official guidance on the consent side is worth reading directly too — the CNIL’s page on cookies and tracking devices and the ICO’s guidance on storage and access technologies are both readable without a law degree.

Leon Bauer
Explorer of web analytics and digital measurement tools. I dive deep into features, limitations, and use cases of platforms like Google Analytics, Matomo, Plausible, and others. My mission is to demystify analytics through honest reviews and practical guides.
More about me →