
Your e-commerce store pulled in $47,000 last month. Revenue is up 12% quarter over quarter. The dashboard looks great. But here’s the kicker — you have no idea why it went up, which customers are driving that growth, or whether it’s sustainable. If you’re only tracking revenue, you’re flying blind with one eye on the altimeter and nothing else.
E-commerce analytics goes far beyond the top-line number. The stores that consistently grow are the ones measuring what happens before and after the purchase. Cart abandonment, customer lifetime value, product page engagement, funnel drop-offs, cohort retention — these are the metrics that actually tell you where your money is going and where it’s leaking.
In this guide, I’ll walk you through the metrics that matter beyond revenue, show you how to track them, and explain why ignoring them is costing you more than you think. No fluff — just straight answers.
Why Revenue Alone Tells an Incomplete Story
Revenue is a lagging indicator. By the time you see it drop, the problem started weeks or even months ago. Maybe your product pages stopped converting. Maybe returning customers dried up. Maybe your acquisition costs crept higher than your margins. Revenue won’t tell you any of that.
Think of it this way: revenue tells you what happened. The metrics below tell you why it happened and what to do next. That distinction is the difference between reactive panic and proactive strategy. As I covered in my piece on measuring the ROI of your data investment, the stores that invest in deeper analytics consistently outperform those that don’t.
Moreover, in a world where cookieless tracking is becoming the norm, you need first-party behavioral data more than ever. Revenue alone won’t survive the privacy shift.
E-Commerce Analytics: The 5 Metrics That Actually Matter
Let’s break this down together. Here are the five categories of metrics you should be tracking alongside revenue — and what each one reveals about your business health.
1. Cart Abandonment Rate
What it is: The percentage of shoppers who add items to their cart but leave without completing the purchase. Industry average sits around 70%, according to the Baymard Institute. That means for every 10 people who show buying intent, 7 walk away.
Why it matters: A high cart abandonment rate signals friction in your checkout process. It could be unexpected shipping costs, a complicated form, lack of payment options, or simply a slow page. Each abandoned cart is revenue that was almost yours.
What to track specifically:
- Abandonment rate by device — mobile users often abandon more due to poor UX
- Abandonment by step — where exactly in the checkout do people leave?
- Recovery rate — how many come back after an abandonment email?
- Time to abandonment — do they leave instantly or after hesitation?
For instance, if 80% of your mobile users abandon at the payment step, that’s a clear UX problem — not a pricing problem. Additionally, high bounce rates on your checkout landing pages can compound the issue. I wrote a detailed guide on diagnosing and fixing high bounce rates that applies directly here.
2. Customer Lifetime Value (CLV)
What it is: The total revenue a single customer generates over their entire relationship with your store. If your average customer spends $50 per order, orders 3 times a year, and stays for 2 years, your CLV is roughly $300.
Why it matters: CLV determines how much you can afford to spend acquiring a customer. If your CLV is $300 and your acquisition cost is $100, you’re profitable. If your CLV drops to $80, that same acquisition cost destroys your margins.
What to track specifically:
- CLV by acquisition channel — are Google Ads customers worth more than social media customers?
- CLV by first product purchased — certain products attract higher-value customers
- CLV trend over time — is it growing or shrinking?
- CLV-to-CAC ratio — healthy businesses target 3:1 or higher
Building a solid first-party data strategy is essential for accurate CLV calculation, especially as third-party cookies disappear. Without it, you’re guessing.
3. Product Page Engagement

What it is: How visitors interact with your product pages — time on page, scroll depth, image views, review reads, and add-to-cart clicks. This goes well beyond basic visitor counts.
Why it matters: A product page with 10,000 views and 50 add-to-carts has a 0.5% engagement-to-intent rate. Another page with 2,000 views and 200 add-to-carts converts at 10%. The second page is 20x more effective — but you’d never know that from revenue alone.
Key engagement signals:
- Add-to-cart rate — the most direct measure of purchase intent
- Image gallery interaction — do people swipe through all photos?
- Review section engagement — are customers reading reviews before buying?
- Size/variant selection rate — hesitation here can signal confusion
- Compare/wishlist actions — high wishlist, low purchase means price sensitivity
Furthermore, understanding how cookies and tracking work helps you set up engagement tracking properly without over-relying on invasive methods.
4. Funnel Analysis and Drop-Off Points
What it is: A step-by-step breakdown of how users move from landing on your site to completing a purchase. Every step where a user leaves is a drop-off point — and a revenue leak.
Why it matters: Your conversion rate is the output of your funnel. But knowing the overall rate isn’t enough. You need to know where the biggest drops happen so you can fix them in priority order.
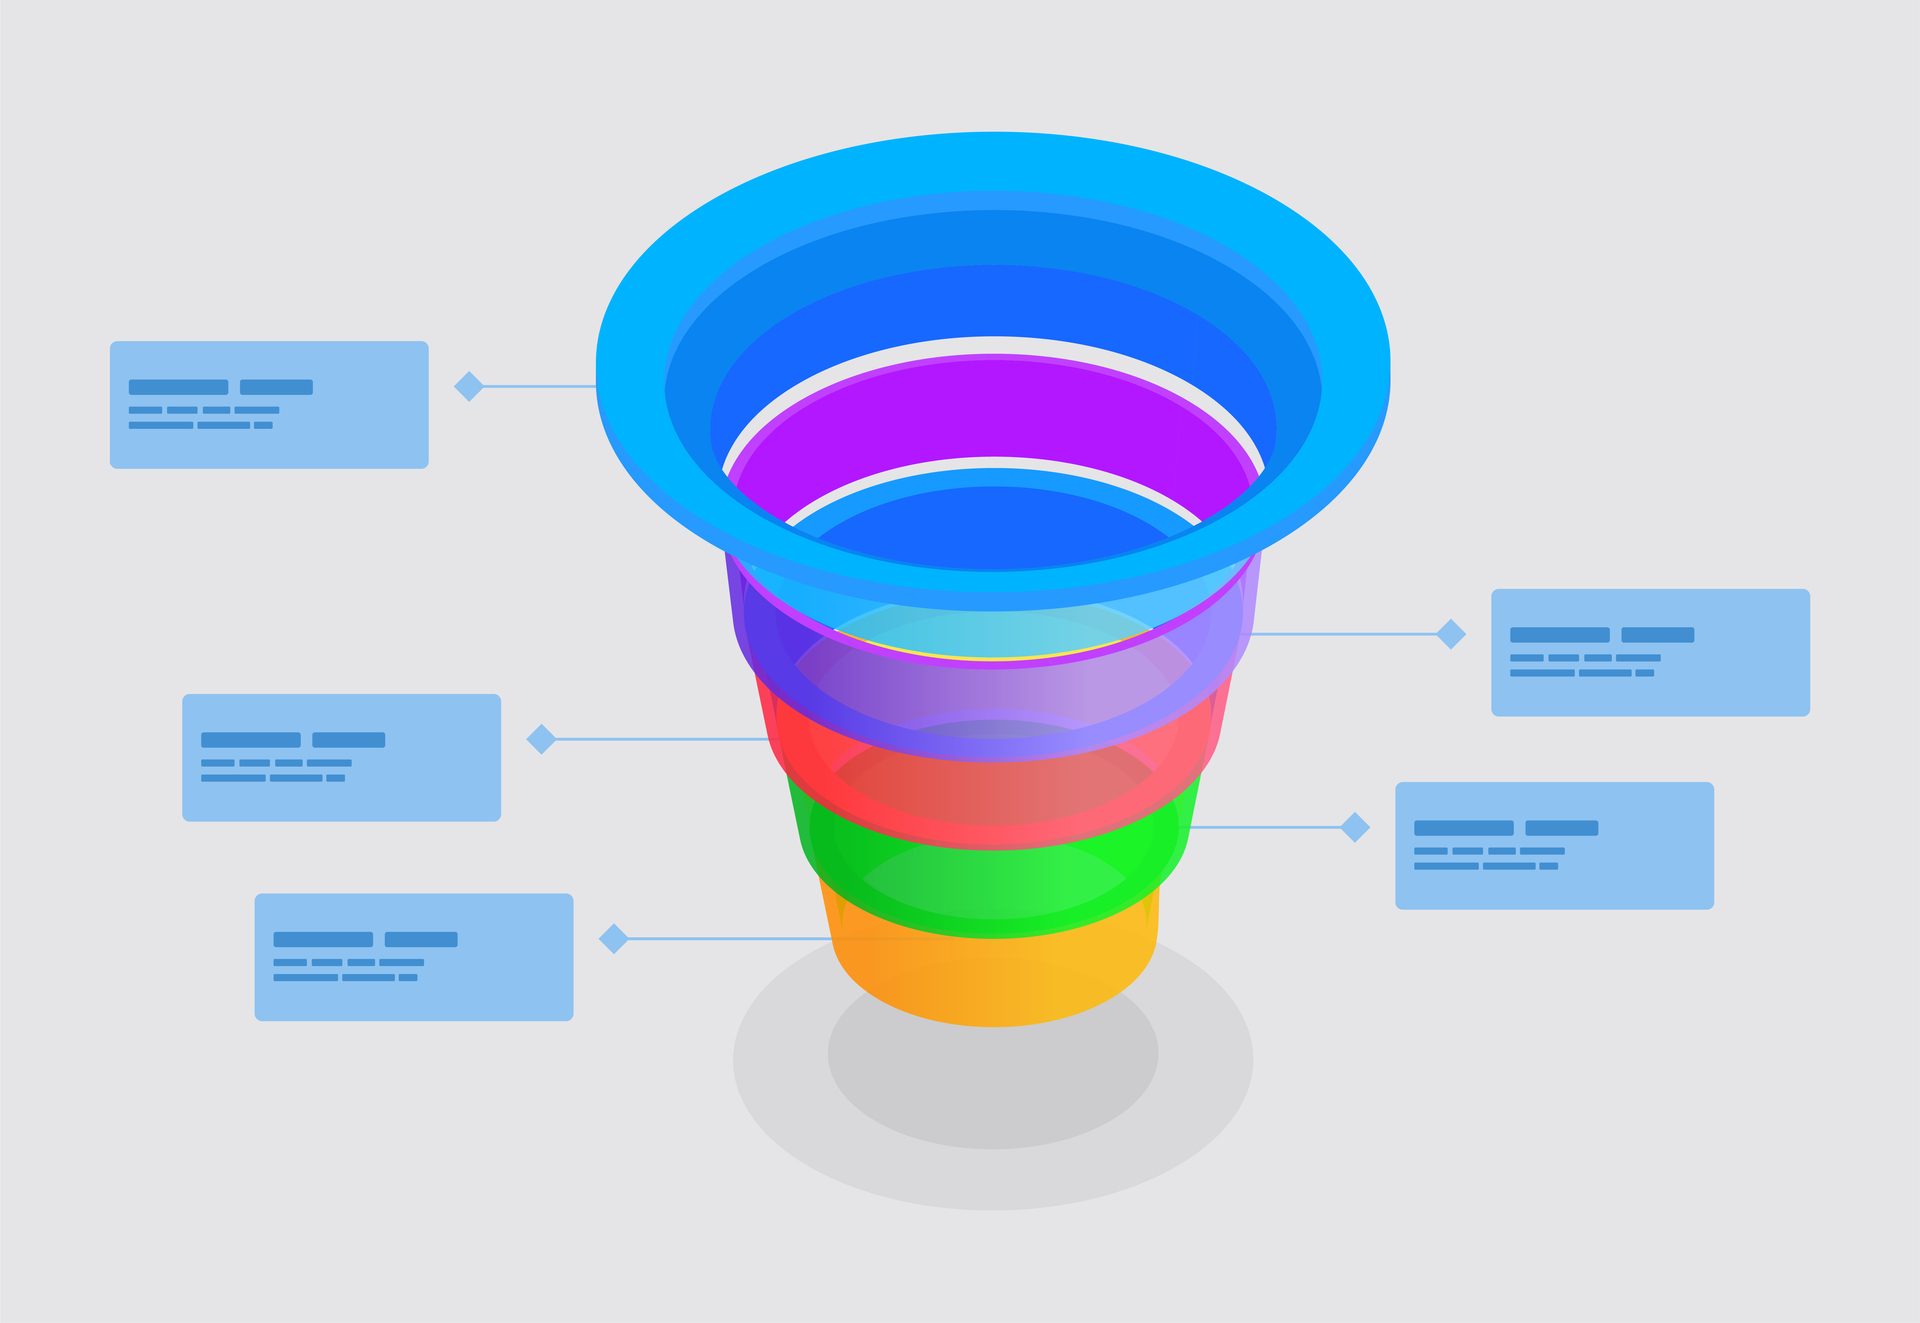
Here’s a practical example of a typical e-commerce funnel:
| Funnel Stage | Users | Drop-Off Rate | Action |
|---|---|---|---|
| Homepage / Landing Page | 10,000 | — | — |
| Product Page View | 4,500 | 55% | Improve internal search, navigation |
| Add to Cart | 1,200 | 73% | Better CTAs, product descriptions |
| Begin Checkout | 600 | 50% | Reduce friction, guest checkout |
| Purchase Complete | 350 | 42% | Simplify payment, trust signals |
In this scenario, the biggest leak is between product page view and add-to-cart — a 73% drop. That’s where you’d focus your optimization efforts first. Consequently, connecting your SEO analytics to business outcomes helps you understand which traffic sources feed the healthiest funnels. When you want to go deeper on a specific drop-off step, heatmaps paired with traditional analytics reveal exactly where on the page people hesitate and leave.
5. Cohort Retention and Repeat Purchase Rate
What it is: Cohort retention groups customers by when they made their first purchase, then tracks how many come back over time. Repeat purchase rate is the percentage of customers who buy more than once.
Why it matters: Acquiring a new customer costs 5-7x more than retaining an existing one. If your repeat purchase rate is below 20%, you’re essentially running a one-time transaction business — and that’s expensive to sustain.
What to track:
- 30/60/90-day retention — how quickly do first-time buyers return?
- Repeat purchase rate by product category — consumables should be higher than durables
- Time between purchases — shorter intervals mean stronger loyalty
- Cohort revenue contribution — do older cohorts still spend, or do they fade?
Also, seasonal traffic patterns heavily influence cohort behavior. A cohort acquired during Black Friday will behave very differently from one acquired in March. Factor seasonality into your retention analysis, or you’ll draw the wrong conclusions.
Tools and Tactics for Tracking Beyond Revenue
Knowing what to track is one thing. Actually setting it up is another. Here’s a practical breakdown of the tools and configurations you need.
Google Analytics 4 (GA4) is the default for most stores. Its e-commerce event tracking covers add-to-cart, checkout steps, and purchase events out of the box. Pair it with Google Merchant Center for product-level performance data that ties directly to your Shopping campaigns.
Shopify Analytics provides built-in cohort analysis, CLV reports, and cart abandonment tracking. If you’re on Shopify, start with their native analytics dashboard before layering on third-party tools. It’s surprisingly comprehensive for most small-to-mid-size stores.
Privacy-first alternatives are worth considering if you want accurate data without consent banner friction. I reviewed the top privacy-first analytics platforms — several now offer e-commerce event tracking that rivals GA4 in depth while staying fully GDPR-compliant.
Here’s a quick comparison of what different tool categories offer:
| Capability | GA4 | Shopify Native | Privacy-First Tools |
|---|---|---|---|
| Cart Abandonment | Yes (with setup) | Built-in | Varies |
| CLV Calculation | Predictive CLV | Built-in | Limited |
| Funnel Analysis | Exploration reports | Basic | Some (e.g., Plausible goals) |
| Cohort Retention | Cohort exploration | Built-in | Limited |
| Product Page Engagement | Enhanced e-commerce | Basic metrics | Event-based |
| Consent Required | Yes (most regions) | Platform-dependent | Often not required |
Bottom line on tools: use what your platform gives you first, then fill the gaps. Most stores don’t need five analytics tools — they need one or two set up properly.
The 4-Step Framework for E-Commerce Analytics
Instead of trying to track everything at once, follow this phased approach. It works whether you’re running a $10K/month store or a $10M/month operation.
Step 1: Audit Your Current Tracking
Before adding new metrics, check what you already have. Most e-commerce platforms track more than you realize — you’re just not looking at it. Open your analytics dashboard and answer these questions:
- Do you have enhanced e-commerce tracking enabled?
- Are checkout steps properly tagged as events?
- Is your product catalog data flowing into your analytics tool?
- Are you tracking both new and returning customer segments?
If you answered “no” to any of these, that’s your starting point. Don’t chase advanced metrics on a broken foundation. If you have recently taken over a store, an analytics audit for inherited setups walks through each of these checks step by step.
Step 2: Identify Your Biggest Revenue Leak
Build your purchase funnel and find the step with the highest drop-off. That’s your biggest opportunity. For most stores, it’s either the product-page-to-cart transition or the cart-to-checkout step. Focus all optimization efforts there first.
Step 3: Set Up Cohort and CLV Tracking
Once your funnel is stabilized, shift focus to retention. Tag customers by acquisition date, source, and first product purchased. Then monitor their behavior over 30, 60, and 90 days. This is where the real long-term growth insights live. If you are migrating from GA4 or another platform mid-stream, export your historical data first so your cohort baselines are not broken by the switch.
Step 4: Build a Reporting Cadence
Data without regular review is just noise. Set up a weekly check on funnel metrics and a monthly deep-dive into CLV and cohort trends. Specifically, track these on a consistent schedule:
- Daily: Cart abandonment rate, conversion rate
- Weekly: Funnel drop-offs, product page engagement, top/bottom performers
- Monthly: CLV trends, cohort retention, channel-level ROI
- Quarterly: Strategic review — which metrics improved, which didn’t, and why
Common Mistakes in E-Commerce Analytics
I’ve seen these mistakes repeatedly across stores of all sizes. Avoid them, and you’ll be ahead of most of your competitors.
Tracking everything, analyzing nothing. Having 200 custom events in GA4 means nothing if nobody reviews them. Start with 5-10 key metrics and actually use them for decisions. More data doesn’t equal better decisions — it often equals analysis paralysis.
Ignoring mobile as a separate segment. Mobile users behave fundamentally differently from desktop users. Their funnels are shorter, their patience is lower, and their abandonment rates are higher. Always segment by device before drawing conclusions.
Confusing correlation with causation. Just because you launched a sale and revenue went up doesn’t mean the sale caused the increase. It could be seasonal traffic, a viral social post, or improved search rankings. Use cohort analysis and controlled experiments in GA4 to isolate variables.
Neglecting post-purchase metrics. What happens after someone buys is just as important as what happens before. Track delivery satisfaction, review submissions, support ticket rates, and return rates. These feed directly into CLV and retention.
Not accounting for privacy changes. If your e-commerce analytics still relies on third-party cookies, your data is already degraded. Consent rates are dropping, browsers are blocking trackers, and regulations are tightening. Build your measurement on first-party data now, or face increasingly unreliable numbers. It also helps to understand exactly what happens when a visitor accepts all cookies — because that data pipeline is where many e-commerce stores are silently losing accuracy.
Practical Example: How One Store Found $12,000/Month in Hidden Revenue
Here’s a real-world scenario that illustrates why beyond-revenue metrics matter. A mid-size fashion retailer was tracking revenue and seeing steady $95K/month numbers. Everything looked fine on the surface.
When they set up proper funnel analysis, they discovered that their mobile cart abandonment rate was 84% — compared to 62% on desktop. The culprit? Their mobile checkout required account creation, and the form was nearly unusable on smaller screens.
After implementing guest checkout and simplifying the mobile form, their mobile conversion rate jumped from 1.1% to 2.4%. That single change recovered roughly $12,000 per month in previously lost revenue. They also found that customers acquired through email had a 3.2x higher CLV than those from paid social — which completely shifted their marketing budget allocation.
None of these insights came from watching the revenue line. They came from looking underneath it.
Frequently Asked Questions
What’s the most important e-commerce metric besides revenue?
If you can only add one metric, make it customer lifetime value (CLV). It connects acquisition cost, retention, and profitability into a single number. CLV tells you whether your business model is sustainable, which channels bring the best customers, and how much you can invest in growth. Everything else — cart abandonment, funnel optimization, engagement — ultimately feeds into CLV.
How do I track e-commerce analytics without violating privacy regulations?
Focus on first-party data collected directly through your store. Transaction data, account activity, and on-site behavior tracked with a privacy-first analytics platform typically don’t require cookie consent banners. Avoid relying on third-party trackers, and be transparent with customers about what you collect. Also, review how cookies and tracking actually work to understand what’s compliant in your region.
How often should I review my e-commerce analytics?
Daily for operational metrics like cart abandonment and conversion rate. Weekly for funnel performance and product engagement. Monthly for strategic metrics like CLV trends and cohort retention. The key is consistency — sporadic data checks lead to reactive decisions. Set calendar reminders and stick to the cadence, especially during seasonal traffic shifts when patterns change rapidly.
Bottom Line
Revenue is the scoreboard. But the metrics I’ve outlined here — cart abandonment, CLV, product page engagement, funnel analysis, and cohort retention — are the game film. They show you what’s working, what’s broken, and where the opportunities are hiding.
Start with one metric. Get it right. Then layer on the next. Within a quarter, you’ll have a measurement system that doesn’t just tell you how much money you made — it tells you how to make more. And in a landscape where cookieless measurement and privacy regulations keep shifting the ground, that kind of clarity is what separates growing stores from stagnant ones.
The stores that win aren’t the ones with the most data. They’re the ones asking the right questions — and actually using the answers.

Leon Bauer
Explorer of web analytics and digital measurement tools. I dive deep into features, limitations, and use cases of platforms like Google Analytics, Matomo, Plausible, and others. My mission is to demystify analytics through honest reviews and practical guides.
More about me →